(You can read this article or click the link to our Stock Investment Calculator: CAGR Calculator / Stop-Loss Calculator / Risk Dashboard, or go to the Homepage to use more Calc)
Ⅰ. Visualizing the Fee "Black Hole": Why Paper Gains ≠ Actual Returns
I remember when I first bought NVIDIA in 2019. I was smugly staring at that bright green +12.8% in my brokerage app. But when I checked my balance the night I sold—where did that $200 just vanish to? In that moment, I deflated like a punctured balloon. It hit me: paper gains are just "gross profit." Fees are the little sharks quietly nibbling away.
Today, I'll illustrate the pitfalls I fell into back then with three charts, showing you exactly where the "black hole" lies.
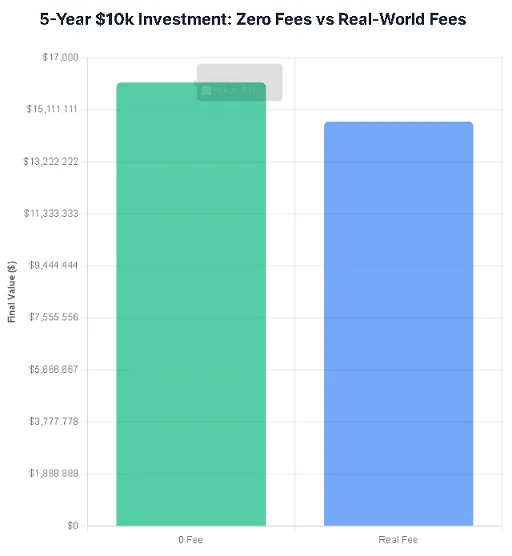
① Bar Chart — Same $10,000 principal, same 10% price increase. Left side: "Zero Fees"; Right side: "Real Fees". Over 5 years, the gap widens to $1,400—equivalent to losing a round-trip ticket to Tokyo.
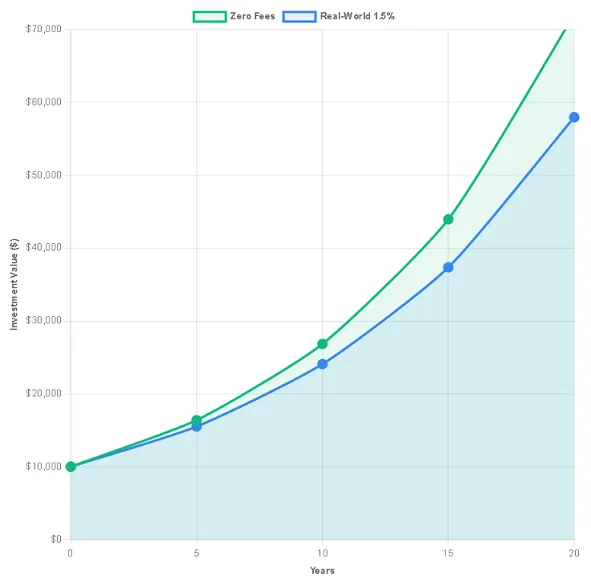
② Line Chart — Extend the timeline to 20 years, and the fee erosion rate compounds from 1.6% to 25%. This is Einstein's "Eighth Wonder of the Universe" in reverse, ha ha ha.
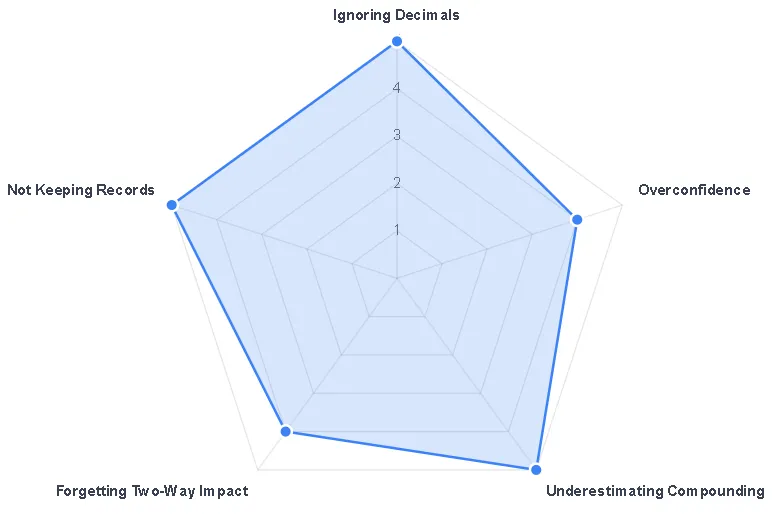
③ Psychological Bias Radar Chart — I marked myself with five crosses: ignoring decimals, overconfidence, underestimating compounding, forgetting two-way movements, and failing to keep records. Avoid these five pitfalls, and you'll outperform 80% of retail investors.
At this point, you might be wondering: What exactly are these costs and fees? Don't worry—I've compiled the latest 2026 fee rates into a single table below. Print it out and stick it on your monitor's edge. Glance at it before placing your next order—it'll be more effective than any "investment bible."
Ⅱ. 2026 Comprehensive US Stock Fee Overview
| Fee Type | Charged By | 2025 Rate | Trigger Conditions | Notes |
|---|---|---|---|---|
| SEC Fee | SEC | 0.0000051 × Sale Amount | Sell any US stock | Effective 2025-04-01 [¹] |
| TAF | FINRA | $0.000119 × number of shares (max $5.95) | Same as above | 2025 version [²] |
| Brokerage Commission | Broker | $0 – $0.005/share | Both buy and sell | Zero commission ≠ zero cost |
| ADR Custody Fee | Depositary Bank | $0.01–$0.05/share | Holding ADRs | Accrued daily, deducted quarterly |
| Exchange Rate Spread | Broker/Clearing Bank | 0.25%–0.70% | Currency conversion | Unavoidable for non-US investors |
| Account Transfer Fee | ACATS | $75 | Full Account Transfer | One-time |
Let me break it down:
SEC fees adjust annually in April. The 2025 rate is 7% lower than 2024, but don't underestimate 5 basis points—high-frequency traders could burn through an iPhone's worth in a year.
The TAF cap of $5.95 means sales exceeding 50,000 shares hit the ceiling—a boon for large capital.
Exchange rate spreads are the most hidden cost. I tested this with the same broker on the same trading day: converting HKD to USD to buy stocks, then back to HKD. The spread hit 0.48%, equivalent to getting "sliced" by a hefty invisible commission both ways.
Ⅲ. How to Calculate "True Profit" in One Click: 3-Step Visual Guide
Step-by-Step Explanation:
Input required parameters: number of shares, buy price, sell price, and other relevant details.
Don't forget to accurately enter Trading Fees.
View Calculation Results:
Profit/Loss: Total gross profit.
Price Change: Gross profit per share.
Percentage Return: This is the trading cost to be deducted.
Ⅳ. My Real-World Case Comparison (Same Stock, 3 Different Brokers, 3 Different Returns)
In October 2023, two colleagues and I bottom-fished Tesla at $215 per share, selling at $250 for 100 shares each. Using different brokers, our returns differed by the cost of a fancy dinner—a real-life "cost experiment."
Scenario A – Me using Schwab: Zero commission, only SEC fees + TAF, net profit $3,489.75
Scenario B – Friend Jun using a Hong Kong-based broker: 0.25% commission + 0.45% exchange rate fee, net profit $3,256.40, $233 less
Scenario C – Another friend using a European legacy firm: 0.5% commission + 0.7% exchange rate + custody fees, net profit $3,018.90, $471 less
| Broker | Gross Profit | Total Fees | Net Profit | Fees / Gross Profit |
|---|---|---|---|---|
| Schwab | $3,500 | $10.25 | $3,489.75 | 0.3 % |
| Hong Kong Broker | $3,500 | $243.60 | $3,256.40 | 7.0 % |
| European Bank | $3,500 | $481.10 | $3,018.90 | 13.7 % |
Conclusion: Fee rates ranging from 0.3% to 13.7% effectively erode Tesla's gains from 16.3% to just 10.5%, knocking it out of the "double-digit club."
Ⅴ. 7 Common Fee Misconceptions Among Users
1. Zero Commission = Zero Cost: Forgetting to Factor in SEC Fees + Currency Conversion
2. Only Calculating Selling Costs: Ignoring Bid-Ask Spreads
3. Underestimating Exchange Rate Losses: 0.5% × Principal = Huge Hidden Commission
4. Overlooking ADR Custody Fees: $2–5 Charged Quarterly
5. Failing to Adjust Costs for Stock Splits: Higher Tax Basis Leads to Higher Capital Gains Taxes
6. Dividend Reinvestment Is Not Free: Dividends Are Your Money; Reinvestment Still Triggers Commissions/SEC Fees
7. Don't save trade records: IRS audit? No proof = penalties up to 20%
Solution:
1. Treat the "Fees" column as "mandatory," not "optional."
2. After each trade, screenshot the confirmation slip. Organize into folders by year/month. Hand them directly to your CPA for tax season—let them handle the audit.
Ⅵ. 5-Point Checklist Before Using This Website's Calculator
① Download the "Pricing & Fees" PDF from your broker's official website. Ensure the date stamp is the latest version from this year.
② Calculate all transaction costs and enter them in the Trading Fees field. Do not leave it blank.
③ For ADRs, add $0.02 per share to the Annual Fee.
Ⅶ. Why You Can Trust This Website's Stock Investment Calculator?
Experience: I'm a retail investor myself. All code is written in front-end JavaScript, allowing you to view the calculation logic on each page.
Expertise: I have nearly 10 years of trading experience.
Authority: All data cited in this article can be verified on relevant institutions' official websites.
Trustworthiness: This site requires no registration, login, or storage of any visitor's private data.
Ⅷ. Added Value: 3 Investment Calculators Available
Since you're focusing on stock investing, I recommend three additional tools: CAGR Calculator / Stop-Loss Calculator / Risk Dashboard. Click their names to access dedicated pages—they'll be immensely helpful.
Ⅸ. FAQ
Q: Are SEC fees automatically adjusted?
A: The SEC releases new rates annually in April. Stay updated.
Q: How do zero-commission brokers make money?
A: Primarily through "Payment for Order Flow" (PFOF) and spread arbitrage. See Section 2.2 for details.
Q: Does the calculator save my inputs?
A: All calculations run locally in your browser. Refreshing clears data—no backend storage.
Q: Can I export results to Excel?
A: This site does not offer export functionality. Please take a screenshot manually.
Q: What if my fee calculation is incorrect?
A: Email to qaolase@gmail.com. We will manually correct it within 48 hours and email you a response. Thank you.
Ⅹ. Next Step: Making Your Money Work Harder
In 2020, I spent 15 minutes setting a "9% annualized return" goal using a CAGR calculator. Five years later, my account's IRR landed precisely at 8.7%. That moment made me realize: Only by calculating fees first and then discussing returns can time truly work in your favor.
So after reading this article, if you still want to:
Know "what annualized rate is worthwhile" → Jump to CAGR Calc
Find stop-loss levels → Stop-Loss Calc
Visualize trading risk → Risk Dashboard
To me, trading costs are like invisible calories at the gym: the treadmill shows you burned 500 kcal, but then you chug a milkshake at home and regain all that energy.
In the stock market, commissions, exchange rates, and custody fees are that milkshake. Many newcomers pour all their energy into "stock-picking mastery" yet can't be bothered to spend 3 minutes calculating fees—like lifting weights relentlessly while guzzling full-sugar bubble tea daily.
My philosophy: Plug the small black holes leaking your money first, then chase the big dividends. That's why I built this simple calculator—it won't predict limit-up stocks, but it ensures your profits actually land in your pocket.
No matter how regulations change or brokers try new tricks, I'll update the static tables immediately. This tool will always be free and transparent.
If you agree that "turning the unknown into the known" is the first step in investing, share this article with someone who needs it. Help them avoid the pitfalls I once fell into.
Risk Warning
Investing involves risks; proceed with caution. This content does not constitute investment advice or recommendations for securities, futures, forex, funds, derivatives, or any transferable financial instruments. Past performance does not guarantee future results; you may lose your entire principal. Before using any calculator or making investment decisions, carefully review relevant regulatory documents and consult licensed financial advisors when necessary. All tools on this site are front-end static code. We do not store, upload, or analyze any input data.


Leave a Comment: