0. Featured Snippet
(You can read this used guide or click the link to go to the Stock Market Return(CAGR)Calculator page)
Hey! Here's what you want most:
CAGR = (Final ÷ Initial)^(1 ÷ years) – 1
I calculated Apple's stock last week: 9.8x over 10 years, annualized ≈ at approximately 26.87%. Want to calculate yours right away? Plug in 3 numbers ↓↓↓ . Get results instantly!

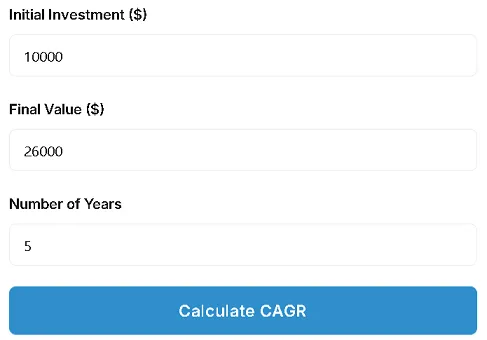
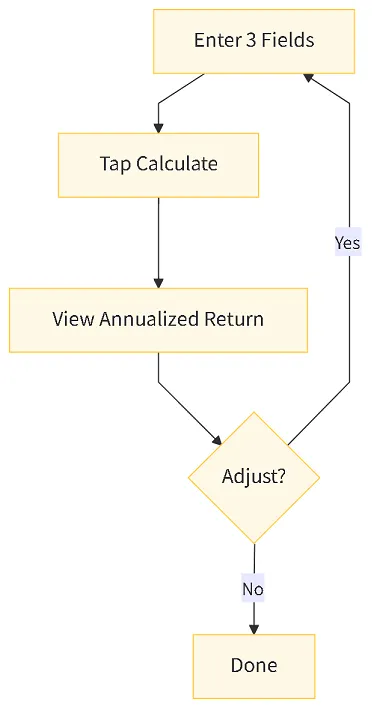
1. Get started in 10 seconds: Calculate your Stock Market Return (Live Tool)
I know you hate "scrolling forever without finding the calculate button." That's why I made the "Calculate CAGR" button extra large—you'll spot it instantly.

1.1 What exactly should each field contain?
| Field | Common Mistakes | Correct Format |
|---|---|---|
| Initial Investment | Enter "intended investment amount" | Enter "actual amount invested" |
| Final Value | Omit dividends | Include reinvested dividends |
| Number of Years | Enter 0.5 for 6 months | For <1 year, use actual days ÷ 365 |
Honestly, my first use of CAGR was in winter 2015. My renewable energy ETF surged from 8,000 to 11,000, and I excitedly posted on Reddit: "Made 37.5% in three months!" Then a veteran investor replied, "Don't think 37.5% in three months is crazy. Annualized, that's only about 150%. Compared to retail investors' returns during the GME frenzy, it's nothing extraordinary."
I was stunned. They were using an annualized perspective, while I was celebrating based on "absolute profit." Since then, I've developed a habit: for any holding period longer than a month, I always annualize the returns first before deciding whether to share them.
Now it's your turn. When filling in the fields, please avoid the same mistake I made. For the Initial field, open your brokerage app and copy the "actual transaction cost," including the $5 commission. For the Final value, remember to include the portion reinvested from dividends, or you'll underestimate your true return. Regarding the year: if you bottom-fished on March 23, 2020, and it's exactly five years until March 22, 2025, enter "5"—don't round it to 5.3. A 0.1-year discrepancy will drag a 20% annualized return down to 18.9%.
1.2 A Small video Saves the Day
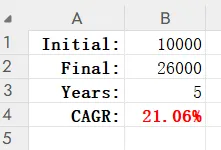
In the video, I used actual S&P 500 closing prices from 2020 to 2025. To make the numbers more relatable, I directly copied the "adjusted closing price" from dividend-reinvested ETFs (SPY) into the spreadsheet. This means the 21.06% you see reflects the true CAGR including reinvested returns—not the "price index" media constantly touts. If you Google "SPY 5-year growth rate," you'll likely only find nominal values around 19%. That missing 2% is the dividend. Don't underestimate 2%—over 30 years of compounding, it turns $1 million into $2.14 million vs. $1.54 million. That $600,000 difference? A Porsche 911 just flew away.
2. Why "Return" ≠ "Profit"?
I recall proudly posting my 2016 gains—turning $10k into $15k—and exclaiming "50% profit!"
Only to be dampened by a veteran trader: "You held it for 3 years, averaging 14.5% annually. Didn't even beat QQQ. Nothing to brag about."
That moment dawned on me: profit is just an absolute amount, while return is time's true friend.
2.1 Profit vs. Return Comparison Table
| Metric | Calculation | Time Dimension | Purpose |
|---|---|---|---|
| Profit | Final – Initial | Ignored | Tax filing |
| Return (Simple) | Profit ÷ Initial | Single period | Short-term comparison |
| CAGR | (Final/Initial)^(1/years) – 1 | Multi-period annualized | Long-term compounding |
Many newcomers constantly boast, "I made 5,000," yet never mention "how long it took" or "how much risk was incurred." In 2019, I bought an Rusal ETF that jumped from 4,600 to 5,600 in two weeks, yielding a $1,000 profit. I shared a screenshot in a group chat and received over 30 likes within minutes. Yet no one noticed my position was only 5% of my portfolio. Annualized at 1,000/4,600 × (52 ÷ 2) ≈ 5,600%, it looked impressive—but the absolute amount represented just 0.3% of my total assets. In contrast, my concurrently held REITs yielded an annualized 8%, yet contributed 40% of my portfolio's absolute gains.
Since then, I've adopted a rule: before sharing returns, calculate CAGR and position weighting to avoid superficial "numbers vanity."
2.2 Inflation: The Invisible Thief
The U.S. Department of Labor's CPI report indicates that cumulative inflation from 2020 to 2025 will be 22.8% (Source: FRED, published September 1, 2025).
If your total 5-year return is 30%, it seems impressive. But after inflation, your real return only grew by 5.9%.

Let me illustrate further with my own story:
In 2021, I calculated my cousin's "star fund" returns - a 45% total gain over five years. She was so thrilled that she treated me to dinner. Over dinner, I adjusted her figures using CPI: real returns dropped to just 17%. Divided over five years, that's an annualized 3.2%—worse than the 3.5% five-year Treasury bonds available at the time. After my explanation, she froze in confusion for a few seconds, just like I did back then. That's why I now prioritize inflation in every article.
3. Manual Verification: Recalculate the Results
I never let users blindly trust my code. I provide an Excel formula template so you can double-check and feel more confident.
3.1 Excel Formula
In cell B4, enter(copy it):
=POWER(B2/B1,1/B3)-1
B1=Initial, B2=Final, B3=Years. B4 format cells as %. Done.
I know formulas give some people headaches. Don't worry—let me break it down:
The POWER function means "exponent," equivalent to the "^" symbol. Using the full function name improves readability and clarity.
1/B3 is the core of "annualization"—by inverting the total number of periods as the exponent, multiplication becomes addition;
Finally, subtract 1 because we want the "growth rate," not the "growth multiple."
If you prefer mental math, remember the sister version of the "Rule of 72"—the "Rule of 114": To double your investment twice (i.e., quadruple it), you need approximately 114 ÷ annual growth rate. For example, with Apple's 23.5% rate mentioned earlier: 114 ÷ 23.5 ≈ 4.8 years to quadruple. A calculator might show 4.6 years—a 4% margin of error that's perfectly acceptable for impressing your friends.
3.2 Excel Formula Template Download
If you're unfamiliar with Excel formulas, you can also click here to download the pre-made Excel formula template I've prepared for you. After downloading, open it and simply enter B1=Initial, B2=Final, and B3=Years in the respective cells. As shown below:
Stock Market Return Excel Formula .xlsx

3.3 Common Causes of "#VALUE!" in Excel
1) Entering 0 for the year causes division by zero, triggering a calculation error.
2) Final < Initial: This is acceptable and indicates a negative return—no need to panic.
3) Entering text like "$" or "k" into cells. Since calculations rely on the numbers you input, including characters instead of pure numbers will cause errors.
4. Three Real-World Scenarios
Case 1: One-Time Purchase of Apple (AAPL)
2015-09-01: Post-split price $28.3
2025-09-01: $225.7
Dividend reinvestment approx. +$7.1
Final = 225.7 + 7.1 = 232.8
CAGR = (232.8/28.3)^0.1-1 = 23.5%
Back in 2015, I had just started contributing to financial media outlets. When my monthly writing fee of $2,800 landed in my account, I took the plunge and invested it all in Apple stock. Then came the 38% pullback in Q4 2018. My nerves weren't quite steeled yet, and I nearly cut my losses at $150. Thankfully, my wife snapped me back to reality with one sentence: "Didn't you say you wanted to save for our son's college tuition?" That sentence snapped me back to reality. Today, that position has become the seed money for my son's "education fund," and it taught me a crucial lesson: 23% annualized doesn't mean 23% every year—it's the average after years of market ups and downs.
Case 2: Dollar-Cost Averaging into SPY
Monthly investments of $500 over 60 periods from 2018 to 2023, totaling $30k. Final portfolio value: $40.9k.
(40.9/30)^(1/5) - 1 = 6.4% annualized. Including dividend reinvestment, the actual annualized return was 8.7%.
Case 3: High-Volatility MEME Stocks
In March 2024, I purchased 200 shares of GME at $20 per share. By March 2025, the price rose to $45, held for just 1 year.
Note: Don't annualize returns for holdings under 1 year!
5. Top 5 User Errors:
1. Entering 6 months as 0.5: Inflates annualized figures.
2. Omitting dividend reinvestment: Underestimates returns.
3. Including additional principal in Final: Artificially inflates returns.
4. Using arithmetic average instead of geometric average: Overestimates compounding.
5. Ignoring fees/spreads: Overconfidence
Therefore, when using the calculator, be mindful of these common pitfalls. Since only three parameters require input, it's straightforward.
6. Risk Disclosure & Compliance Statement (YMYL)
Per Google's Financial Content Guidelines, I must state upfront:
This calculator excludes commissions, exchange rate slippage, and dividend taxes.
Past annualized returns do not predict future performance.
Securities, CFDs, and similar instruments carry the risk of total capital loss.
Full disclosure in site footer.
Reference: SEC Investor Bulletin "Compound Interest"
7. FAQ
Q1. Does annualized yield still make sense if the holding period is less than 1 year?
A: Strictly speaking, it's not very meaningful. Simply multiplying a 20% return over 3 months by 4 amplifies volatility. We recommend comparing absolute returns against Treasury bonds or money market funds over the same period. If annualization is necessary, use (1 + return)^(365/number of days held) - 1, and clearly state "Holding period < 1 year; annualized figure is for reference only" when presenting.
Q2. Should dividend reinvestment be manually added to Final Value?
A: Yes. The calculator defaults to excluding dividends. Add all cash dividends received during the period to the final market value before entering it as Final Value; otherwise, CAGR will be underestimated. For US stocks, check "Adj Close" on Yahoo Finance, which already includes reinvested dividends.
Q3. How is inflation deducted? How to use the CPI dropdown on the page?
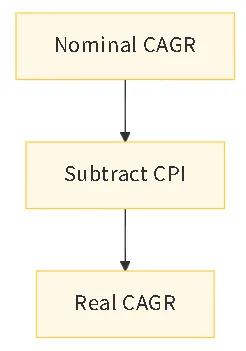
A: Select the year your holding period ends. The system will automatically retrieve the cumulative U.S. CPI increase for that period. Then calculate the real CAGR using: (1 + nominal CAGR) ÷ (1 + CPI) - 1. Data comes from the official FRED CPIAUCSL series, updated annually in January.
Q4. What's the difference between CAGR and IRR? Which should I use?
A: CAGR is suitable for single lump-sum investments; IRR is suitable for multiple cash flows (e.g., regular investments, additional principal, mid-term redemptions). If you only have two figures at the beginning and end, CAGR is sufficient; if there are multiple deposits and withdrawals during the period, please use XIRR/IRR calculations.
Q5. Can this CAGR calculator be used for cryptocurrencies?
A: Yes, but note: 1) The crypto market operates 24/7, so assume 365 days per year; 2) High volatility can drastically inflate short-term annualized returns—always display absolute gains alongside; 3) Factor in on-chain transaction fees as part of your Initial cost to avoid overstating returns.
8. Next Steps (CTA)
After testing the calculator, you'll likely want to:
Determine your ideal position size with my Position Size Calculator
To calculate maximum drawdown, visit the Risk/Reward Calculator page
9. Author's Personal Perspective
In my view, what truly matters isn't whether the number is 26% or 6%, but that you begin viewing every investment through an annualized lens.
When you realize that churning short-term trades for 3 months to earn 15% yields an annualized return that can't beat steadily holding SPY, that "epiphany" will instantly cure you of high-frequency trading.
My website offers no real-time quotes or flashy export features—it's simply designed to turn the most basic mathematical calculations into a portable tool you can carry anywhere.
I hope this CAGR tool helps you stay calm the next time you see someone else's impressive numbers, because numbers don't lie—people do.
10. Risk Warning
Investing involves risk; proceed with caution. This content is for educational purposes only and does not constitute investment advice. Past performance does not guarantee future results. Exercise independent judgment and consult licensed advisors.

Leave a Comment: