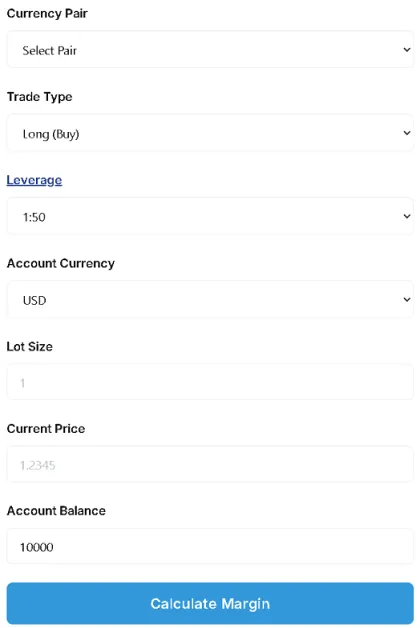
(You can read this guide or click the link to the Calculator tools pages: Profit/Loss Calculator and Margin Calculator)
Hello! I'm Qaolase, the site administrator. This article will use 4 simple tools to calculate exactly how much you can earn!
Table of Contents
1. Basic Profit Formula (Long/Short)
2. Leverage, Dividends, Currency Conversion
3. Full Breakdown of Hidden Costs
4. All-in-One Online Calculator
5. Reverse Target Price Tool
6. Stop Loss & Risk-Reward
7. 2024 Live Trading Case Study (NVDA)
8. Common Mistakes
9. FAQ (People Also Ask)
10. Risk Disclosure & Safety Tips
Ⅰ. The Fundamental Profit Formula—Don't Get Fooled by Short Videos. Master 3 Elementary Math Steps First
I remember the night in April 2020 when WTI crude oil plunged into negative territory. Someone in the group shared their trade: "I shorted 1,000 barrels at $36, closed at -$37, and made over $70,000!" I clicked on his screenshot. Holy cow—20x leverage, but the commission field was blank. I left a comment: "Bro, did you factor in the financing interest?" The next day, he DM'd me: "Damn, after interest + overnight fees, I only made $43k..."
That's today's theme—don't just calculate gross profit. Master the formula first.
Long Position (Buy/Long) - Pure Cash Account
Net Profit = (Sell Price − Buy Price) × Number of Shares − Commission − Dividend Tax − Currency Conversion Fee
The table below shows a simplified example (USD pricing, commission $0.005 per share):
| Item | Value |
|---|---|
| Purchase Price | $100 |
| Sale Price | $120 |
| Number of Shares | 200 |
| Commission | $2 ($0.005 × 200 × 2) |
| Dividend Tax | $0 (None this time) |
| Net Profit | ($120 − $100) × 200 − 2 = $3,998 |
Selling Short (Sell/Short)
Net Profit = (Sell Price − Cover Price) × Number of Shares − Borrowing Rate − Commission − Dividend Compensation
Note: Short-selling profits are capped (the sell price is the ceiling), while theoretical losses are unlimited. Therefore, stop-loss orders are essential.
Cash vs Margin Trading vs CFDs
Cash: No interest, no forced liquidation.
Margin: Annualized 3-8%, daily interest accrual, broker may liquidate.
CFD: Spread + overnight swap, leverage up to 1:20 (varies by regulated region).
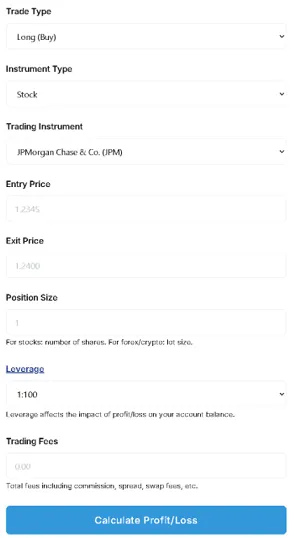
Ⅱ. Advanced: Leverage, Dividends, Currency Conversion—Put a "Magnifying Glass" on Every Trade
In May 2024, I went long NVDA at $405 with a target of $480, but my account only covered 50 shares. I switched to a 4x leveraged CFD representing 200 shares. After the earnings report that night, the stock gapped up +24%. I was thrilled, but after swaps and spreads, my profit dropped from 24% to 18.6%—leverage is a double-edged sword, amplifying both gains and costs!
Leverage Multiple vs. Actual Margin
Margin = Stock Price × Number of Shares / Leverage
4x leverage requires a 25% margin; if the broker's maintenance margin is 20%, a 5% drop triggers a margin call.
Dividend Adjustments
Long positions: Receive dividends minus 30% withholding tax (US stocks).
Short positions: Pay equivalent dividends to the lender.
Currency Conversion
When buying Alibaba shares in Hong Kong, brokers default to converting HKD→USD. The 0.2% exchange rate difference shouldn't be overlooked in large transactions.
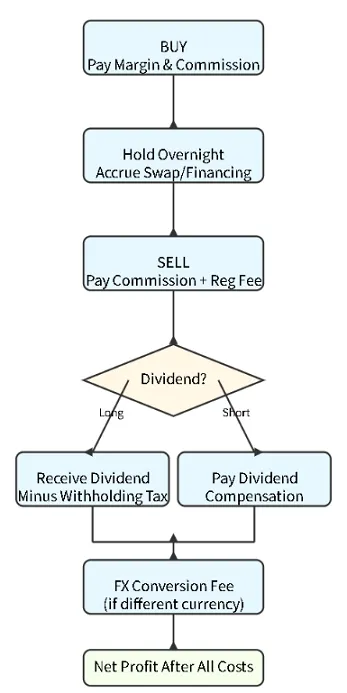
Ⅲ. Hidden Costs Decoded—Don't Let "Small Numbers" Devour Your Annual Returns
I analyzed my 42 US stock trades in 2023. Commissions accounted for only 38% of total costs, with the remainder comprising financing fees, exchange rates, and regulatory charges. Below is a breakdown of these "hidden" costs:
| Fee Type | Cash Account | Margin Trading | CFD |
|---|---|---|---|
| Commission | $0.005/share | $0.005/share | 0 (included in spread) |
| Financing Interest | 0 | Annualized ≈6% | Annualized ≈4% |
| Overnight Swap | 0 | 0 | Long: –0.6 / Short: +0.3 |
| Platform Fee | 0 | $1/month | 0 |
| Exchange Rate Spread | 0–0.3% | 0–0.3% | 0–0.5% |
| Regulatory Fee (SECTAF) | $0.0000051 × Selling Amount | Same as Cash Account | Included |
(Data Source: FINRA 2025 Fee Schedule)
Ⅳ. Reverse Target Price Calculator — "I want to make $500. At what price should I take profits?"
Last year, a reader asked me: "I only have $800 in my account and want to make $500. What should I buy?" I replied: "First calculate your risk allowance, then work backward to the target price."
Reverse Formula:
Target Price = Entry Price ± (Expected Profit + Total Fees) / (Number of Shares × Direction Coefficient)
Direction Coefficient: Long = 1, Short = −1.
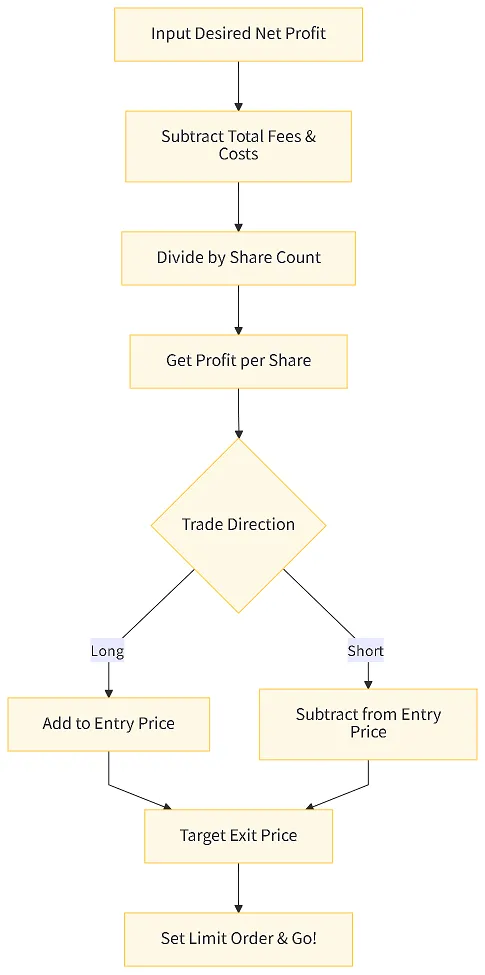
Expected net profit → Minus fees → Divide by shares → Adjust entry price → Output target price.
Ⅴ. Stop Loss & Risk-Reward Ratio—Don't Let a Black Swan Kick You Out of the Game
My 2020 crude oil trade blew up because I skipped stop losses and went all-in with leverage. That night taught me: Stop losses aren't predictions—they're insurance.
Three Stop Loss Methods
Fixed Amount: Single loss ≤ 2% of account balance.
Technical Levels: Previous lows/moving averages/ATR.
Time-Based Stop: Exit if position held for N days fails to meet expectations.
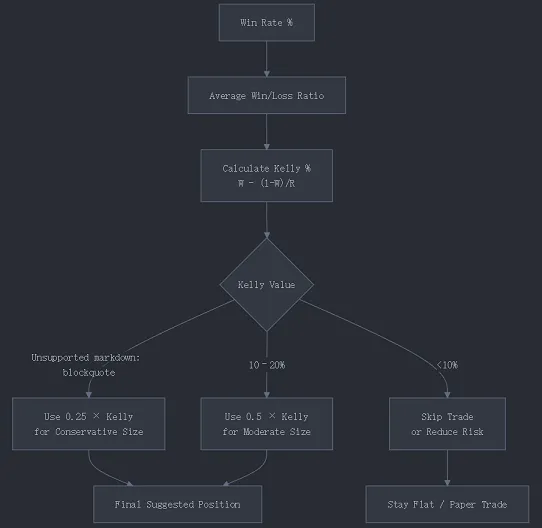
Kelly Formula
Kelly % = (Win Rate × Average Profit/Loss Ratio − Loss Rate) / Average Profit/Loss Ratio
Example: Win Rate 55%, Profit/Loss Ratio 2:1 → Kelly = (0.55 × 2 − 0.45) / 2 = 32.5%
Practical tip: Never go all-in with Kelly. Using 0.25×Kelly is safer.
The table below shows drawdown comparisons for different Kelly ratios:
| Kelly Ratio | Maximum Drawdown (Historical Backtesting) |
|---|---|
| 1.0× | 63 % |
| 0.5× | 32 % |
| 0.25× | 16 % |
(Data Source: Kelly Criterion—A 2025 Summary by CME Group)
Ⅵ.. 2024 Live Trading Case Study—NVDA Swing Trading: How I Used a Calculator to Lock Risk at 1.8%
May 23, 2024, NVDA after-hours earnings release. I pre-emptively bought 50 shares at $405 during the day (cash). After hours, the stock gapped up from $405 to $480. I input the data into the calculator:
Target $480, Stop-loss $390, Shares 50, Commission $0.25/side.
Risk = ($405−$390) ×50 + $5 = $755
Account balance then: $42k → Risk percentage: 1.8% < 2% ✅
The next day opened high at $502. I used the calculator's reverse function: "If profit is $3,000, what should the target price be?" Output: $495. I placed a sell order at $495, which executed at $498. Net profit: +$4,630 (after deducting commissions + 3-day financing swap).
Ⅶ. 5 Common Mistakes—90% of Newcomers Fall Into These Traps
1. Forgetting ex-dividend dates—suddenly "forced" to receive dividends when shorting.
2. Ignoring currency conversion — Buying Alibaba in Hong Kong stocks with a 0.2% exchange rate difference compounds to 4% annually over 20 trades.
3. Using market stop-losses — Flash crash slippage of 5%. Use limit stop-losses or option hedging instead.
4. Mental math on financing interest — "Only 0.02% daily" adds up to 0.6% over 30 days, eating half your profit.
5. Using Kelly as Position Size — Going straight to 1×Kelly? A 60% drawdown will leave you crying.
Ⅷ. FAQ (People Also Ask)
Q1. Does this calculator use real-time prices?
No, everything is manually entered. No API, no cookies, no database.
I prefer to keep control in your hands: enter whatever price feels comfortable to you. Real-time quotes = distraction + impulsiveness. Calculate first, then open your trading platform—don't reverse the order.
Q2. Is data uploaded to servers?
URL hashes appear only in your browser's address bar—my servers receive zero data.
I can't even see your calculations. It runs entirely locally; you can even continue offline.
Q3. Can it calculate crypto/forex?
Yes. Just think of "shares" as "coins/lots"—the formula works universally.
BTCUSD: Entry 26,000, Exit 27,000, 0.1 coins, fees set to exchange maker rate 0.1%. Still shows net profit. Leverage and swap logic apply identically.
Q4. What's the maximum leverage multiple I can enter?
The frontend caps it at 1:50 to prevent accidental entries like 500x.
If you truly need to calculate extreme leverage, change the "Leverage" field to 100. But first, read the ESMA regulations—EU limits are 1:30 for major currencies and 1:5 for stocks. Don't push the envelope.
Q5. When is the financing interest (swap) charged daily?
For US stocks, most brokers charge after 10:00 PM EST. CFD platforms vary; MetaTrader displays 00:00 platform time. The formula calculates based on "calendar days," including weekends. Thus, holding a position for 3 days = enter 3.
Q6. How does "dividend compensation" auto-calculate for short positions?
Enter the ex-dividend date dividend as a negative value. Example: $1 per share dividend → short 200 shares → enter "Dividend" field as -200. Net profit will automatically deduct compensation.
Q7. Why does the calculated net profit differ by a few dollars from broker statements?
Real-time exchange rate fluctuations—I lock rates at entry time.
Regulatory fees rounding—SEC/FINRA minimum is $0.01, fractional shares round up.
Slippage—limit vs. market orders can cause $0.01 spreads to result in several-dollar differences.
Differences <0.5% are normal. If >1%, screenshot and DM me—we'll review the formula together.
Q8. Can I embed this on my own blog?
Absolutely. The code is open-source under MIT license. Just keep the footer link "Powered by YourSite" — it also counts as a dofollow backlink for me, a win-win.
Q9. Is there a mobile app?
Currently only a responsive web page. Add it to your iOS/Android desktop as a bookmark for a native-like experience. An app is in the pipeline, but we're collecting 1,000 email requests first before development. We don't want to build something nobody uses.
Ⅸ. Investment Risk Disclosure & How to Stay Safe
Past performance does not guarantee future results. The calculator provides "what-if" scenarios, not guarantees.
U.S. residents: Read SEC Investor.gov foundational materials first.
EU users: Comply with ESMA leverage limits (1:30 for major currencies).
Always follow this sequence: Demo account → Small positions → Full positions.
Ⅹ. Author's Story & Why You Can Trust Me
I'm not a CFA or investment banking VP—just a retail trader with nearly 10 years of experience, who's blown up three times yet still survives.
In 2019, I built Excel spreadsheets for position management. By 2024, I'd rebuilt them in JavaScript for my blog.
Transparency Pledge: All calculator tools feature publicly available source code. Anyone can audit data security and computational logic.
Personal Perspective & Outlook
In my view, "calculating" matters more than "guessing." No one controls market movements, but costs, positions, and stop-losses are entirely within your control.
Plans:
Add option Greek calculators (Gamma/Theta).
Translate calculators into 7 languages for zero-cost access by non-English users.
Release monthly "Fee Transparency Reports" comparing real spreads + swaps across major brokers.
If you want more powerful tools, write your requests in the comments—I'll prioritize reasonable ones for development.
FINRA 2025 Fee Schedule

Leave a Comment: